COVID-19 has now been confirmed in 181 countries/regions, has infected over one million people and claimed more than 54,000 lives (Source: JHU; as of April 3, 2020). China faced the initial onslaught of the novel coronavirus (COVID-19) and was eventually forced to impose stringent travel restrictions and partial/complete shutdown of its factories. Many Chinese factories, manufacturing products for companies all over the world, experienced decreased production. In this article, we shall look deeper into how Chinese technological innovation surges forward. US enterprises must consider how their innovation may affect this competitive global market.
Preliminary data from the National Bureau of Statistics of China indicated a 13.5% dip in industrial production index for January and February. Exports tumbled by 17%. Retail sales dropped by 21%. Fixed asset investment decreased by 24.5%. As a result, China’s GDP projections for the first quarter of 2020 have been revised from 5.9% to 0.2% YoY growth. As such, this slow-down will have a ripple effect on global industries that rely on China either directly or indirectly.
The global supply chain has already been disrupted by the pandemic. A recent report predicts that certain technological segments, such as smartwatches, notebooks, digital assistants, smartphones, video game consoles and televisions are expected to report an immediate 4 – 20% dip in global shipments in the first quarter of 2020. For example, Foxconn, manufacturing for Apple, shut down its factories resulting in a shortage in iPhones. Further, several technology conferences and keynotes have been canceled, postponed or moved online which will likely stifle innovation due to missed opportunities for partnerships and collaborations.
The global innovation index ranks China at 14th and Hong Kong at 13th while the United States is placed 3rd in the list. Both China and the United States have made significant investments to help accelerate their economic recovery. Spurred by government investments, Chinese companies may use this opportunity to transition from their traditional fast-follower position to become innovation leaders, particularly in areas such as telecommunication equipment and semiconductors.
MaxVal looked at patenting activity as a primary indicator of innovation to gauge where China is currently in terms of innovation. For the purposes of this post, we have compared patent application and grant trends between China and the United States of America.
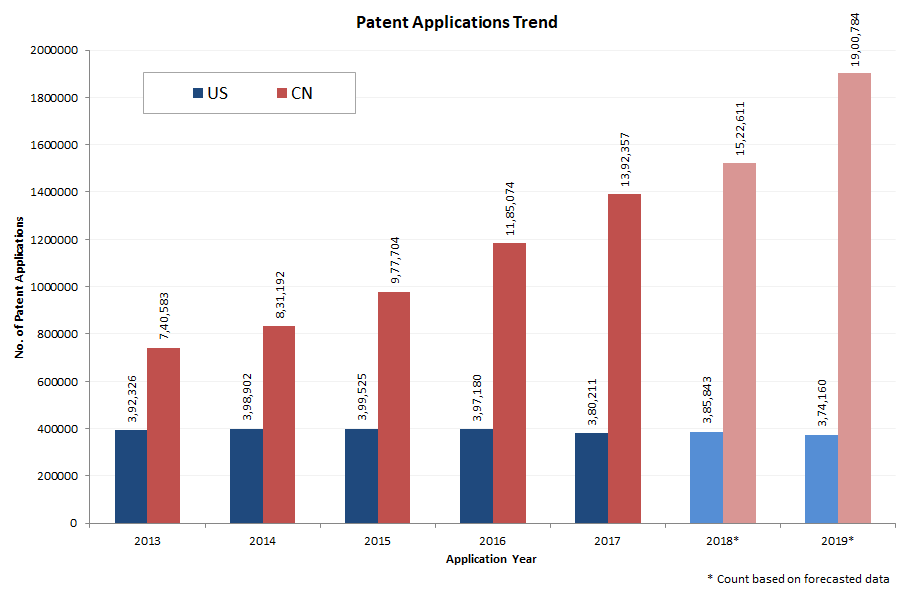
As depicted in the chart above, the total number of patent applications filed in China (excluding design and utility models) far exceeds the number of applications filed in the US. While the rate of applications filed in the US has been fairly constant from year to year, China’s application numbers have increased at an alarming rate. For example, our projections indicate that nearly 1.9 million patent applications were filed in China in 2019. By comparison, the US is projected to have only 374,160 applications. These counts represent both resident and non-resident applicant filings.
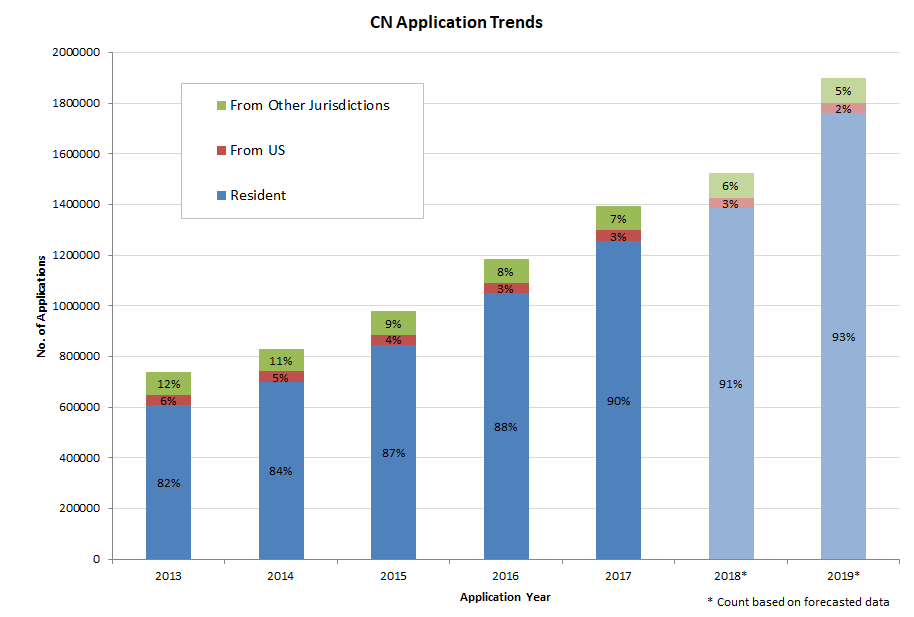
Domestic first-filings in China have increased from 82% in 2013 to a projected 93% for 2019. The overall count of applications originating from the US and other jurisdictions and filed in China has remained flat over the years. This indicates that the increased filing activity in China is primarily from its domestic applicants.

As we stated above, domestic first-filings in the US have remained nearly constant over the years. Incoming US applications originating from China have also not changed much between 2013-2019. The resident and China-based applications in 2013 were 232,675 and 12,589, respectively. The resident and China-based applications in 2019 were 222,624 and 22,180, respectively.
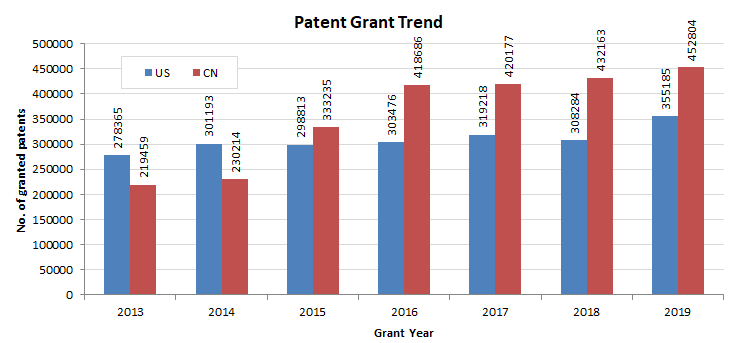
Yearly patent grant trends can provide some measure of potential economic threats and opportunities that could arise from local and foreign applicants. However, please note that use of grant data as a measure of inventiveness can be skewed by the fact that prosecution periods do vary from between jurisdictions. A quick look at data from 2013-2019 indicates that the number of patents granted by the Chinese patent office has not changed dramatically between 2017-2019, while the USPTO grants appears to have increased in 2019.
Another measure of inventiveness is the number of applications granted within 18 months of filing. Typically patent applications do not get prosecuted within 18 months. However, some inventions are so novel (i.e. inventive) that there is insufficient prior art to warrant a longer prosecution period.
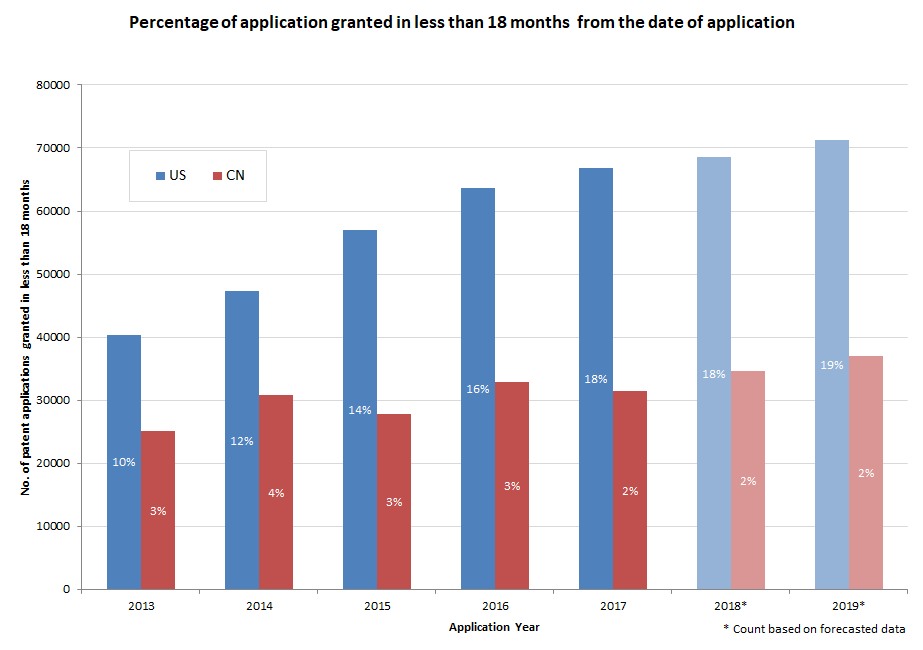
The graph, above, provides some interesting insights into the grant patterns between the US and China. Despite the total number of applications remaining fairly flat in the US, applications granted in less than 18 months have increased steadily from 10% to 19% between 2013-2019. In absolute terms, the US number is projected to be more than 70,000 in 2019. MaxVal observes the complete opposite trend in China. While the total number of patent applications filed in China increased rapidly over the same period, the percentage of applications granted in less than 18 months remained flat at around 2%. In absolute terms, the number is projected to be about 35,000 .
Further breaking down the applications granted in less than 18 months into resident and non-resident filings will help us determine inventiveness of the domestic applicants in the US and China.
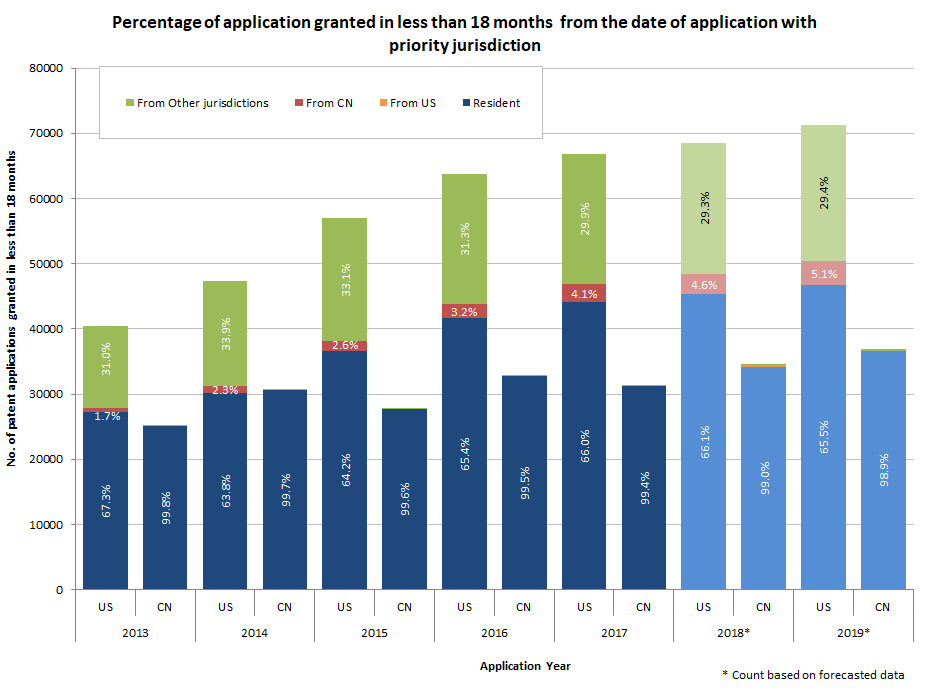
The graph, above, makes clear that US-resident filings are generating more patentable inventions than Chinese-resident filings. Approximately 35% of patent applications granted in less than 18 months each year in the US originate from other jurisdictions, including China (about 4-5%). By comparison, in China almost all the patent applications granted in less than 18 months originated in China. It would be interesting to study whether any delays in non-resident grants in China can be attributed to domestic bias.
Yearly patent applications and grants in China are higher than the U.S in absolute terms. A very small percentage of filed applications (around 2%) are granted quickly in China whereas approximately 18% are granted quickly in the US. The increased number of quick grants in the US is mainly derived from domestic filings. While this may be assuring for the United States, the patent landscape in China is evolving quickly. The Chinese government is actively promoting research in new technologies, encouraging domestic applicants to seek patent protection, and promising improved patent prosecution and enforcement. Notwithstanding the effects of COVID-19 on Chinese economy and perhaps because of its global effects, it may not be long before China becomes a real economic threat to the U.S.A.
Patent Publication Trends 2021 offer valuable insight into the state of innovation worldwide. Analyzing patent publications can provide us with a better understanding of global invention trends, as well as an up-to-date look at influential technology advances and developments in many fields. Please contact us If you like to see comparisons of other jurisdictions or an in-depth decimation of worldwide data into relevant industries and companies based on patent strength.
Update: China becomes top filer of international patents in 2019 amid robust growth for WIPO’s IP services, treaties and finances. Read the article here.
Let us know what you’d like to see in our next blog/webinar. Take the Reader Poll